


Fig. 1. Protein of various food-stuffs, with earthworms coming out tops at nearly 70% (Lawrence & Millar, 1945 – https://www.nature.com/articles/155517b0) [Google/Wiki].

Fig. 2a. Infamous Atlantic cod stock over-fishing collapse in 1990s [MEA].

Fig. 2b. Atlantic cod in context of World fisheries, now at highest ever levels [FAO].

Fig. 2c. World fisheries in context of global meat; i.e., ocean fisheries supply about the same as poultry, or less than one quarter of total meat [OWinD] (Mt = million t).

Fig. 2d. World fisheries in context of total food (excluding meats, eggs, & dairy from cows, buffalo & goats which alone amount to over 600 Mt milk per year). Thus ocean fish supply less than 1% of total human food [FAO]. Also excluded are yields of pasture, forestry, sugar (the World’s biggest crop), vegetable oils & fibers (e.g. cotton, wool, jute, bamboo, etc.). Overwhelmingly, food, fuel & fiber come not from sea, but rather from soil (that also filters all our drinking water from rainfall via percolating earthworm burrows).


Fig. 2e. Actual annual fish catch is a paltry 80 Mt gross [Wikipedia; OWinD], less even than poultry at 100 Mt; thus, contrary to what some marine scientists claim or imply, fisheries “food need” funding argument for Marine Science flounders.

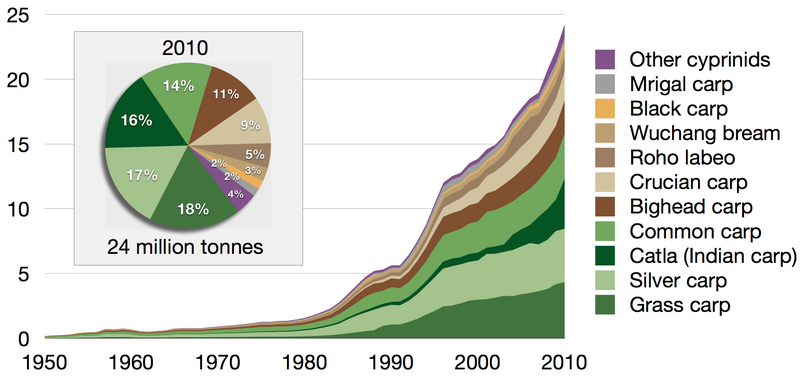
Fig. 2f. Global fish aquaculture produces ~60 Mt gross (upper chart), this mainly of freshwater carp (lower chart), also of tilapia & shrimp; mainly in China (61%) or Asia (75% total) [Wiki]. This is less than global chicken egg production of about 68 Mt per year [Wiki]. Total fish capture is about the same as poultry & aquaculture is about same as eggs, thus ocean yields are “chicken feed” compared to land productivity.

Fig. 3a. Land requirement for proteins (cf. Fig. 1), reminding that land area is finite [Ref.] as is the choice, or addictive habit (certainly not the need), for red meat [OWinD].

Fig. 3b. Meat is yet increasingly consumed in Asia, particularly in China from 1980s [OWinD].


Fig. 4. Meat over-consumption is in affluent, temperate North, but Australia is worst [EPA; OWinD]. Australia (closely followed by New Zealand) also has World’s highest rates of cancer at 2% of population – https://ourworldindata.org/grapher/share-of-population-with-cancer-vs-gdp. Protein diets from Fig. 1 show meat option of just 100 g per person per day (~36 kg/yr) would meet over half of daily requirement, yet India with >40% of its population vegetarian has much lower needs, lowest cancer rates and delicious foods. People have survived in health & abundance without meat for millennia, otherwise we would not be here now; the recent over-consumption is an affectatious affliction.

Fig. 5a. Human population growth exponential, mainly in Asia after WW2 [Wikipedia].
 Fig. 5b. Population increase (due to wealth?, health?, education?) started before synthetic N fertilizers by Haber-Bosch method were introduced after WW1 [Ref.]. [Ron Nielsen iprimus]. Biological Nitrogen Fixation (BNF) by free-living and symbiotic soil microbes.

Fig. 6a. Nitrogen (N) is required for plant proteins, but most synthetic N is lost [EPA].

Fig. 6b. Synthetic Nitrogen mainly used in Asian agriculture from 1970s [OWiD].

Fig. 6c. Excess Nitrogen pollution is a major global problem (as with CO2) [EPA] [Ref.].

Fig. 6d. Cf. Nitrogen sources & sinks [after Fowler et al. 2013: fig. 3].

Fig. 6e. Cf. Excess Carbon problem (and solution!) also from agriculture [NASA/NOAA as modified by Blakemore 2016a]. Ironically, excess synthetic N depletes natural soil C (and N!) due to microbial respiration and other processes [Ref.; Ref. Fig. 3].


Fig. 6f. Subsidies for farmers/pharmas from taxes, mainly for chemicals [TWSJ; Ref.].

Fig. 7a. Chemical pollution is another major global problem [Tilman et al. (2002)].

Fig. 7b. Pesticide use multiplied, despite Rachel Carson’s ‘Silent Spring’, with dubious crop yield benefit [Ref.]. “On a global scale, the past five decades have witnessed an eightfold increase in annual fertilizer N consumption, while cereal production has tripled. (Besides fertilization, approximately 50% of this yield increase has been attributed to genetic improvements [by traditional crossbreeding of varietal hybrids] [Stuber et al., 1999; Duvick, 2005], while the remainder is due to a twofold increase in land area under irrigation and a fourfold increase in pesticide usage [Tilman et al., 2001].)” [Ref.].

Fig. 8. Planetary boundaries for Life-on-Earth are critically over-stretched and may settle at much reduced levels [Ref.]. Causes are population increase & excessive agrichemical meat production. Until the Earth is stabilized, all research efforts & funding should focus on Soils, not be wasted on “pie in the sky” Space nor abysmally squandered on Sea. Time is running out for responsible Action as we are on the immediate cusp of Consequences.

Fig. 9. Especially rates of extinction are increasing – the model above is of species decline from original 100% (blue) by more than 40% (black) [Newbold et al. (2016)]. Conservation is the only Science that is against the clock as we lose ~2 species/hour [Ref., Ref., Ref.]. Oceans support ~10% of global biodiversity, thus ~90% is in or upon soils [Ref., Ref.]; with minor biodiversity in freshwater (lakes, rivers) that occupy just 1% of total land area.

Fig. 10. Most natural nett primary production (NPP) is on land in tropics; oceans are void deserts [sciencemag.org]. Land deserts must be restored to increase productivity.


Fig. 11a,b. The inescapable reality of the situation is demonstrated strikingly in the two graphics showing trajectory for mean 2 degree Centigrade rise by 2020 at Rothamsted Research Station (due partly to chemical agriculture they espouse) which is the upper limit set by the Kyoto Protocol, COP10 and COP21; also NASA’s latest global data showing 2016 & 2017 as the overall hottest years on record [Ref., Ref., Ref.]. Note that climate change is perhaps the fourth (#4) most serious environmental threat, after species extinctions (#1), nitrogen excess (#2) and chemical/nuclear pollution (#3) (see Fig. 8 ).

Fig. 12a. Offering hope is if earthworms can survive in abundance they will naturally rebuild fertile topsoil humus both continuously & for free! They process all atmospheric CO2 in 12-yr cycles storing carbon as SOM (humus), as per the global “4per1000” Initiative [Ref., Ref.].


Fig. 12b. Salvation is also available from geothermal energy that reaches only 1-5% of its potential which may be up to 20 times higher in Asia, especially for resource-rich Japan. Solar, wind & tidal are obviously intermittent – only geothermal & hydro-electric are regular, un-depletable & SAFE with no chance of pollution, meltdown, fall-out, decommissioning over decades nor disposal storage of radioactive materials for millennia; thus mitigating need for resource wars [Ref.; Ref.]. New projects like HADES – the Hotter and Deeper Exploration Science in Taupo, NZ – may extend geothermal capacities (Ref.).
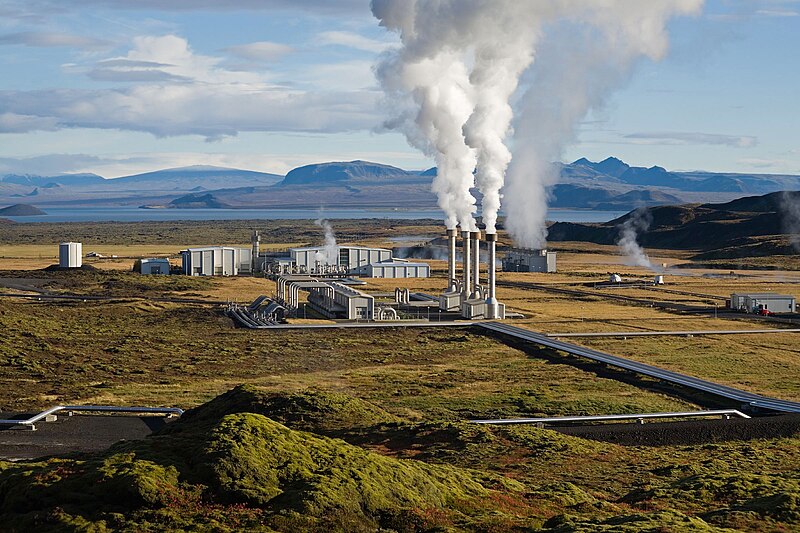

Fig. 12c. Geothermal sites in Iceland & Philippines offer cheap, clean, & constant energy. Plants can be scaled & installed almost anywhere (even offshore) with sufficient incentives; there is no better choice for broadscale comfort or commerce if we want to avoid toxic pollution and terminal extinction [Wiki].

Fig. 12d. There is no-beef with No Beef as the least painful food option [Ref.]; the route to this is ending red meat subsidies/propaganda. At the same time all organic “waste” needs to be recycled and (vermi-)composted as natural fertilizers for healthy food production. Inert charcoal, much-promoted as “biochar” or “charcola”, offers no benefits over conventional, well-proven and wholly natural compost for SOM storage. Neither does it make sense to deploy expensive and harmful fertilizers while good “waste” is wasted (cf. Howard’s Law-of-Return) nor use toxic pesticides when organic farming /IPM offers many safer alternative options (e.g. Ref.).

Fig. 12e. It is not all bad news: Optimistic progress is no excuse for complacency; new challenges are for continued wealth, health & education whilst conserving topsoil humus to provide safe & compassionate food [graph from OWinD by Peggy Olive at suzuki-elders.org; Ref.]. Whilst UN’s 17 SDG’s fail to mention soil specifically (while covering oceans & water in depth), they do admit “Land and soil degradation undermine the security and development of all countries” [Ref., Ref.].

Fig. 12f. Aquaculture of fresh & sea fish matches natural capture, both are at highest rates ever.

Fig. 13. Permaculture alone can solve soil, food, health, housing, energy & climate problems based upon solid practical & ecologically sound, yet also caring, scientific principles [Ref.]. Inspiring quote is from Dr Bill Mollison (4 May 1928–24 Sept 2016); although personally advocating a red meat habit, he reasonably accepted dairy, egg & fish substitutes. Permi-practitioner, Geoff Lawton is manifestly successful in his “Greening the Desert” project in the Dead Sea region of Jordan [Ref.].


 Fig. 14. Some bono fides are: BSc (Hons.) Ecology from Westminster Uni. 1981; PG Diploma in Computer Science at London Uni. 1984; PhD Tropical eco-agriculture Uni. Qld. 1994; Permaculture Design Course (PDC) Certificate from Lisa & Bill Mollison with Darren Doherty in Tasmania in 2000-2001 (awarded 18/5/01); Certificate in Business Management (NEIS), Australia 2001; PG Cert. Geothermal Energy from University of Auckland in 2011-2012 (awarded 6/3/2012) motivated after 11/3/2011 Tohoku Earthquake disaster in Japan with Fukushima critical meltdowns; Permaculture Sustainable Building Cert., Zaytuna Farm PRI at Channon, NSW (with Geoff Lawton) June-July, 2016 – https://permacultureglobal.org/users/18462-rob-blakemore. Plus much subsequent research and the publication of about 250 scientific papers and reports…
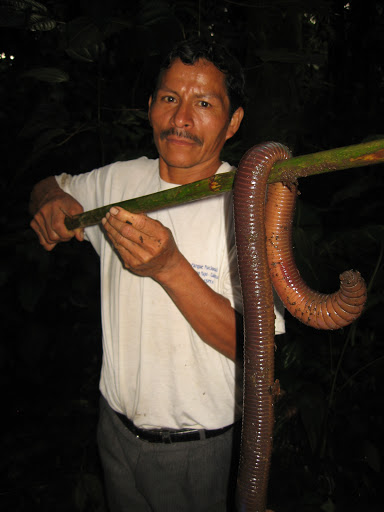
Anyone for a worm-kebab?
Fig. 15. Feature image of Giant Ecuador earthworm from Sumaco Volcano identified as Martiodrilus crassus (Rosa, 1895) that is an ample food for natives [e.g. Ref.]; photo courtesy of Steph (Hoppy) Hopkins, from www.projectnoah.org/spottings/426166028. This specimen is about 160 cm long and weighs about 500 g. The largest earthworms are in the range 500-600 g each whereas the mean biomass per worm is often around 0.2 g. This difference ratio is about 3,000 times which is about the same as the ratio of an average human (50 kg) to a blue whale (about 140 tonnes). That is more food-for-thought.
Most other images are from Internet, as acknowledged for fair use review, or from the author’s earlier studies. Comments, suggestions, improvements, or constructive criticisms, welcome…
PS. After completion I found two other compelling graphics, represented here:-

Fig. 16. Land utilization, with crops on 23% of the 50% of habitable land that is farmed (just 11.4% overall land area) suppling 83% of all our food and 67% of human protein [OWinD]. Note that urban areas are about 1% (proponents of “vertical farming” please note!) and freshwater (e.g. swamps, lakes, rivers, dams) also just 1%. If less meat was eaten, more land could be allocated to crops without deforestation… Fish, on the other hand, consists of about 20% protein (Fig. 1) from 180 Mt (Figs. 2) = ~36 Mt protein per year for human consumption, or contributing only about 6.4% of total protein diet (less even than Milk that supplies 10% see below) further reducing justification for ocean grant fundings…

Fig. 17a. Fish/seafood supplies just 6.4% of all human food protein (and since half is cultured, just 3.2% may come from ocean catch – see note below); fully 93.7% is from land & 40.4% from cereal crops (efficiently from just 11.4% of total land area in Fig. 14 above). This chart clearly shows how public & private funding for research & restoration should be properly allocated:- 94% to soils & organic production! In reality most funds go to marine science which is ironic since ocean runoff/pollution problems are entirely due to agrichemical misuse of soils… [Graph by Dr Mike Boland of Riddet Institute, N.Z].
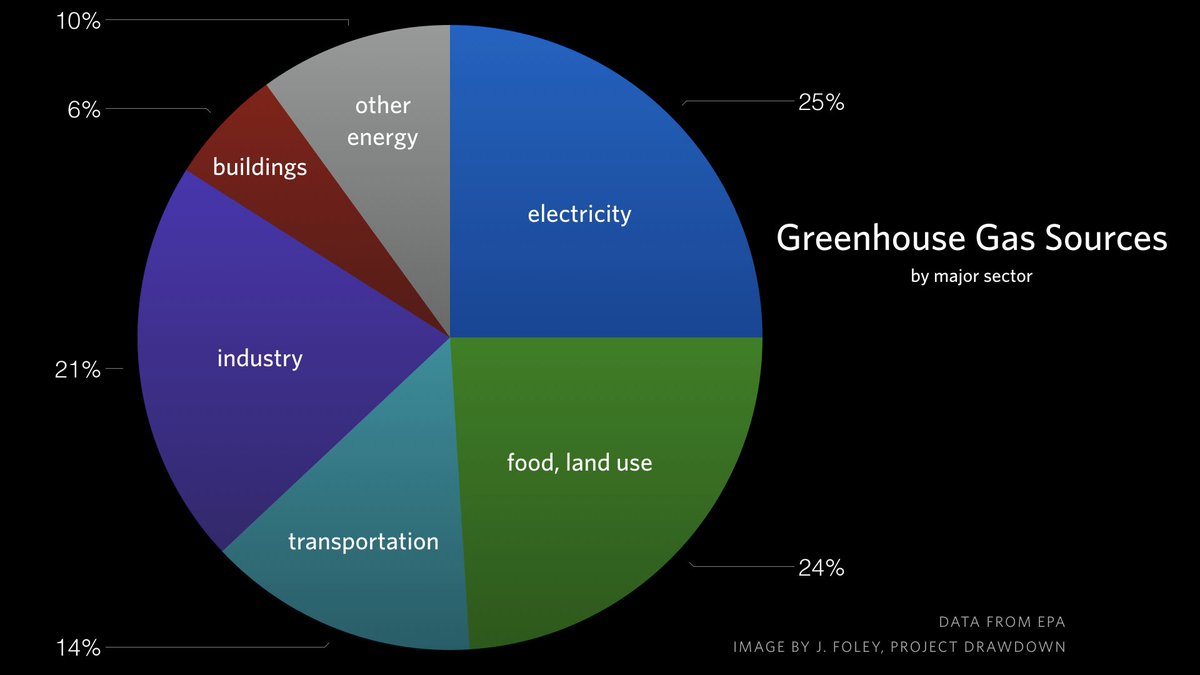
Fig. 17b. Globally, land use & transportation (partly of food!) are ~40% emissions. Cf. US…

Fig. 18a The Diet Americaine – Greenhouse gas emission proportions from average US diet – 75% from meat/dairy! (from http://css.umich.edu/factsheets/carbon-footprint-factsheet). 
Fig. 18b The Lifestyle Americaine: trains, planes & automobiles are major CO2 source. This unsustainable extravagance has to stop. Drive cars or eat meat, but not both or you will sink the planet through pure greed or the ignorance of these excesses.
PPS. In case you missed the link above, here is Scott London’s insightful 2005 Bill Mollison interview succinctly summarizing the theme of this current science blog (or “sclog”); please read it here: http://scott.london/interviews/mollison.html (if deleted, try Way Back Machine links).
R.J.B Zama
Note: An oft quoted “fact” (or its intimation) is that oceans provide food (or sometimes just protein) for between 3 – 4.5 billion of the 7.5 billion human population (e.g. WWF Ref.; Ref.), giving an unfiltered suggestion that the ocean feeds half of the world. However this may not be quite true as FAO (2016) have fish provision at just 6.7% of all protein consumed and, since about 50% is aquacultured, just 3.35% of human food protein is oceanic catch (similar to 6.4/2 = 3.2% in Fig. 17 above). This FAO report also states that some 57 million people were engaged in the primary fish production sectors, a third of them in aquaculture. An earlier unverified report (FAO, 2014) had claimed “fish now accounts for almost 17 percent of global population’s intake of protein” and that “fisheries and aquaculture support the livelihoods of 10-12 percent of the world’s population”, i.e., about 800 million people; yet they also report “some 60 million people engaged in capture fisheries and aquaculture”, which is a much lower figure realistically employed in fisheries closer to their later 57 million estimate. Moreover, the “almost 17%” of fish protein is just for total animal protein intake, as confirmed by WHO (Ref.), i.e., excluding vegetable proteins (and dairy)! This WHO report concludes: “Fish contributes up to 180 kcal per capita per day, but reaches such high levels only in a few countries where there is a lack of alternative protein foods grown locally or where there is a strong preference for fish (examples are Iceland, Japan and some small island states). More typically, fish provides about 20-30 kcal per capita per day… Worldwide, about a billion people rely on fish as their main source of animal proteins.” Even if true, from this we may deduce that the vast majority of us – viz. 6.5 billion – don’t.
Some back-of-an-envelope calculations: Total ocean fish catch is ~100 Mt/yr. Protein in fish ~20% thus = ~20 Mt fish protein/yr. Protein required per person per day ~50 g x 365 days = 18,250 g/yr or ~0.018 t/yr. Thus total need is 0.018 t x 7.5 billion humans = 140 Mt/yr protein, of which ocean fish may provide 20 Mt or ~14% total human protein. However, total meat production is three times as high at ~300 Mt/yr with ~30% protein content = ~90 Mt meat protein/yr, or about 64% of human needs (excluding plants, dairy or eggs). Thus my estimate is ocean fish provide, at most, 3 – 14% of human protein although actual protein consumption may be higher thereby lowering fish’s contribution. For instance, as long ago as in 1841 Justus von Liebig estimated average adult dietary intake of 120 g protein per day (Ref.). Allowing that fish are an important part of human diet, the undeniable fact is their global contribution is minimal compared to land sources of human food and/or protein. To suggest otherwise is a fabricated falsehood.
Apologies in a graphical review for these last two paragraphs that would be unnecessary if marine scientists were more honest about their “facts”… And, yes, some folks go angling, but so too do many garden, hunt, keep chickens or, in India, have “family pet” milk cows.

Food for Thought III fig 7b was very interesting.
LikeLike